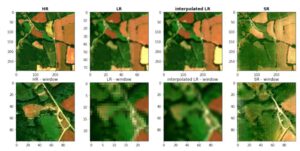
M.Sc. Thesis: Deep Super-Resolution of Sentinel-2 Time Series
The M.Sc. thesis was resarched, written and defended at the University of South Brittany in Vannes, France between Februrary and June 2022.
This e-Portfolio hosts a selection of projects and assignments, it is updated regularly as new assignments are completed. The e-Portfolio is a mandatory part of the EMJMD CDE – Copernicus Master in Digital Earth at the Universities of Salzburg, Austria and South Brittany, France.

The M.Sc. thesis was resarched, written and defended at the University of South Brittany in Vannes, France between Februrary and June 2022.
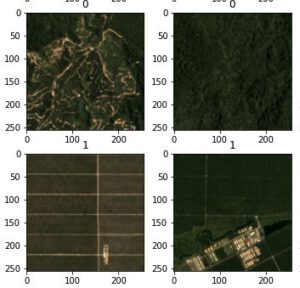
Several predefined deep learning computer vision models, such as LeNet, ResNet18, VGG16 and AlexNet are used to identify palm oil plantations in satellite images. The models are both trained from scratch and used as a feature extractor via transfer learning on the pretrained models.
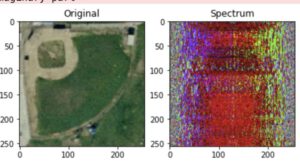
Performing some Fourier Transformations and filtering operations on images.
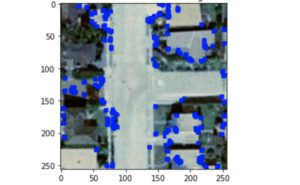
Performing edge extraction, Harris corner point identification and Hughes line detection. Additionally, a Haralick texture analysis is performed and a k-Nearest Neighbor approach tested basted on the texture information.
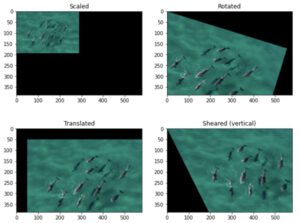
Performing different matrix manipulations to geometrically alter images and reproject the color in different color spaces.
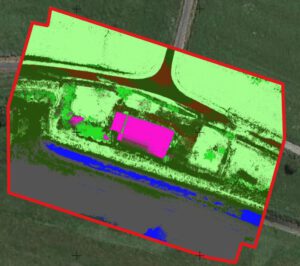
Following an UAV data acquisition, orthoimages for RBG, RE, and NIR bands as wel as a DSM are calculated. Different combinations of these images are fed into a classification algorithm to test how important each band is for the resulting classification.
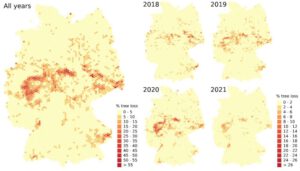
Report of Internship at German Aerospace Center, completed in 2021.
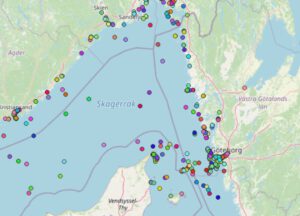
Based on the global marine traffic dataset, several MapReduce functions are implemented in Python via ‘mrjob’.
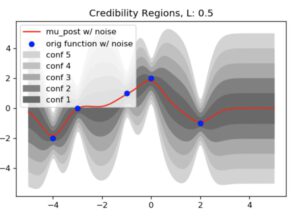
. In this notebook, Gaussian Process Regression is performed based on perfect and noisy data in order to show the basic principles behind the process.
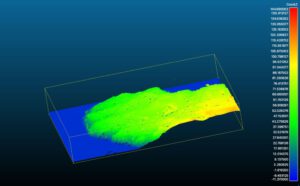
In this project, two point clouds of the same suburb near Christchurch in New Zealand are loaded into CloudCompare and the difference in altitude is calculated.
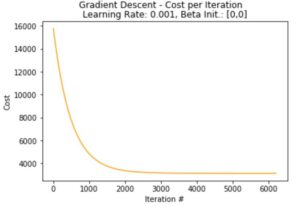
The following notebook performs simple and multivariate linear regression for an air pollution dataset, comparing the results of a maximum-likelihood regression with a manual gradient descent implementation.
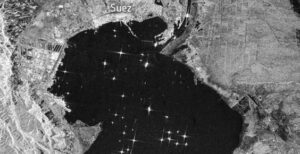
Based on the paper by M. Stasolla and H. Greidanus from 2016, a workflow is followed to estimate ship sizes based on Sentinel-1 imagery. Most importantly, a fundamental element in their workflow is the usage of mathematical morphology to “clean” the SAR image in order to estimate the real-world boundaries of ships
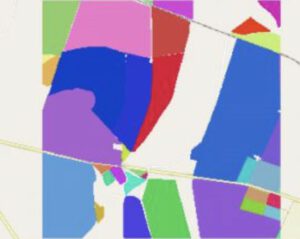
Hosted on the Zindi Data Science and Machine Learning platform, the “Radiant Earth Spot the Crop Challenge” challenges participants to correctly predict the type of crop grown on fields in South Africa, based on Sentinel 2 imagery.
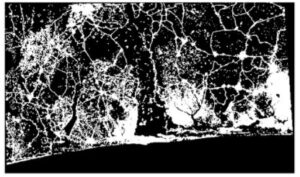
In this image processing class, some exercises were completed in (Binary) Mathematical Morphology. The used methods are erosion, dilation, opening, closing as well as skeletonize and convex hull. The binary image in this case is a geotiff representing sealed surfaces (1) or unsealed surfaces (0) in the Golf of Benin, spanning Togo, Benin and Nigeria
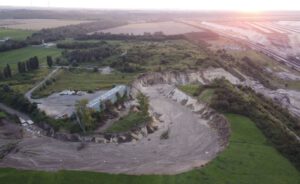
Using Photogrammetry, a newly formed erosion channel of the ‘Inde’ river is mapped. After the heavy rains in Germany in July 2021, the river reclaimed its former riverbed and floods the open pit mine.

Big thanks to Professors Josef Strobl, Stefan Lang, Dirk Tiede, Barbara Hofer and the whole Board of Professors at ZGIS for granting me the “Outstanding Student of the Year” Award by ESRIs Innovation Program.

Summary of PAISS Artificial Intelligence Summer School, organized by INRIA and the institutes PRAIRIE and MIAI in July 2019.
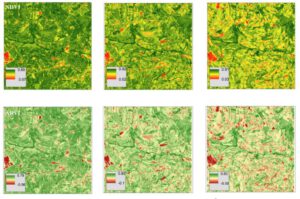
For the EO4GEO Summer School, a project on predicting maize crop yield in Kenya using time series data and a random forest was completed. Our work was presented at the AGIT2021 conference.
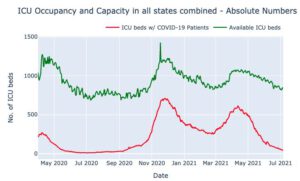
Creating a Dashboard, visualizing ICU occupancy rates in the Austrian federal states. A ubuntu 18.04 server hosts an Apache & WSGI installation, which runs a Plotly Dash via Flask. The data is automatically scraped and served via a GeoServer.
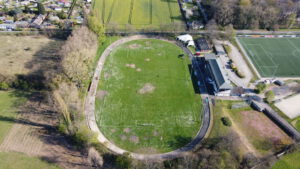
Aerial surveying of a 1920s era velodrome. Creation of DSM and Orthophoto in order to calculate track characteristics such as bank angle, track lenght and width as well as the turn radius.
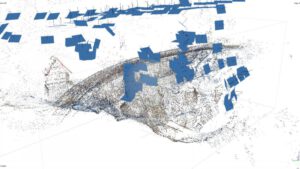
Using a UAV, a dam is photographed and surveyed via GCPs. Metashape then creates point clouds, a mesh as well as a DSM.
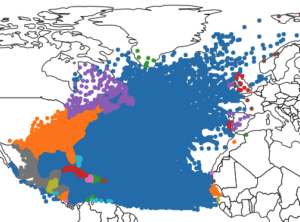
The dataset that is worked with consists of roughly individual 40.000 data points of hurricanes. The aim of my workflow is to predict the future speed and bearing of the individual hurricanes using a Neural Network and a Random Forest Regressor. The data will be cleaned, features created and the prediction will be assessed for it’s accuracy as well as the two methods compared.
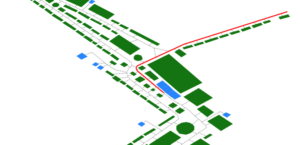
Using pgRouting, a navigation functionality is implemented based on a spatial database of a fun fair, where the user can input his or her position and be routed to a nearest Point of Interest. A Python DB connector dynamically creates the SQL queries and visualizes the results.
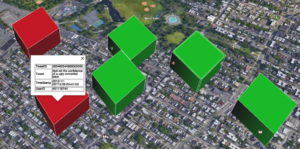
Within the end of term assignment for the Practice of Software Development course, a KML file is created visualizing both the result of an OGC Web Map Service request as well as the parsed information from a CSV file containing tweets and their locations.
Additionally, the tweets are analysed regarding possible profanity and
visualized accordingly.

This blogpost gives short overviews over the topics discussed in the Selected Topics in Geoinformatics Lecture. Instead of summaries of the 10 lectures, brief personal statements and opinions on the topics are given by outlining my personal take-home message from the lectures.
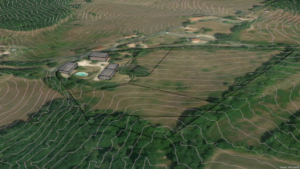
For this freelance project, the task was to perform a very quick suitability analysis for the development of a property in southern France, based on publicly available data.
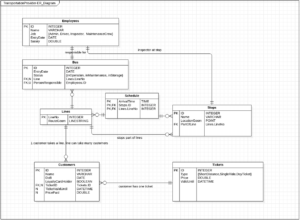
Imagining a relational database for a public bus operator, conceptual and logical databases model are created. The goal is to visualize the entities and their relationships within this scenario.
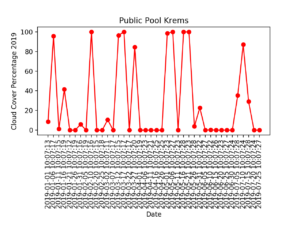
Using the Sen2Cube semantic query model builder, reductions over both space and time are performed on a semantic cube in order to analyse the average cloud coverage both as an image with pixel based information as well as graphs showing the change over time.
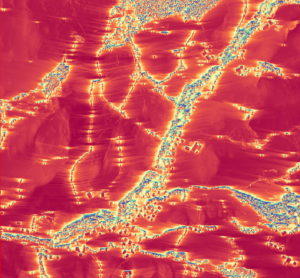
Introduction This assignment deals with an analysis of solar radiation intensity. Since solar power is more in demand than ever due to the increasing demand for renewable energy, suitable locations
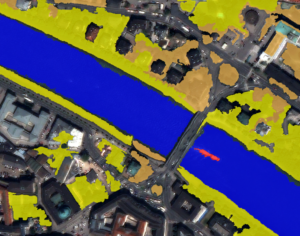
Using eCognition, a quickbird image is segmented based on several spectral and spatial characteristics.
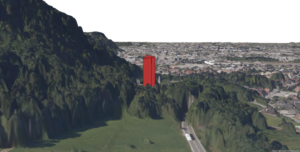
In this project, an imaginary high-rise hotel building proposal is analysed regarding it’s visual impact on the city of Salzburg. Viewshed analysis and Line-of-Sight Analysis are performed.

In this exercise, some role managing and security operations are performed. Roles are created, given permissions and view queries created that allow managing the restriction of information within a database.
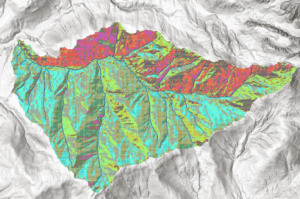
In this post, the Neubach catchment area is analyzed again, this time focusing on surface runoff parameters such as flow lengths, flow accumulations and runoff times.
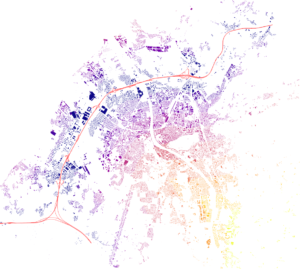
In this exercise, some basic GIS functionalities are performed with SQL/PostGIS commands, such as Union, Intersect and Buffer.
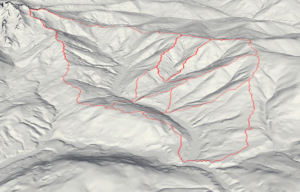
This Post focuses on analyzing a river catchment area, producing slope and curvature statistics and visualizations.
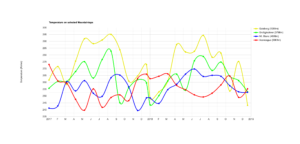
This post shows both the code and the result from Google Earth Engine’s reduced Charts by region for 4 selected mountaintops around the world.
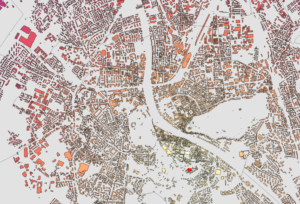
The DBMS PostgreSQL and the geospatial extension PostGIS are used to load Shapefiles into QGIS and perform SQL querries.
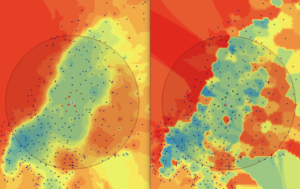
This exercise deals mainly with the IDW method and its parameters, calculating the temperature gradient across Fenoscandia. Also, IDW quality measures are discussed.
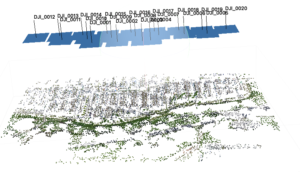
In this Assignment, a workflow is followed that creates a dense point cloud, Orthoimage and DEM from UAV data in Munich, Germany.
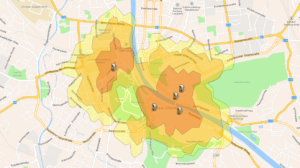
This ESRI ArcOnline Story Map shows the result of the “Network Analysis” assignment of the Methods in Spatial Analysis class.

This article explains how a custom visualization script was loaded into the SentinelHub EO Browser and how the script does it’s job.
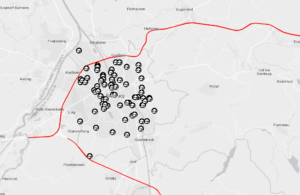
This ESRI ArcOnline Story Map shows the result of the “Distance Analysis” assignment of the Methods in Spatial Analysis class.
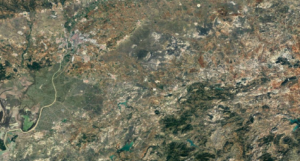
This assignment dives into the different preprocessing levels of satellite imagery and the upcoming trend of Analysis Ready Data within the EO community.
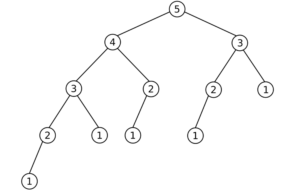
In this exercise, the area of circles are calculated (with user input and error handling), as well as the Fibonacci sequence calculated.

In this assignment, basic queries of SQL queries in PostgreSQL are applied.
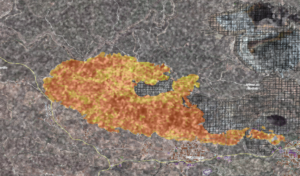
In this exercise for the Advanced Remote Sensing class, a tutorial on how to extract a burnt area from Sentinel-1 imagery was performed.

At the start of the CDE Master, short introductory Presentations were created and published. This ins the introduction presentation, created in Reveal.JS.
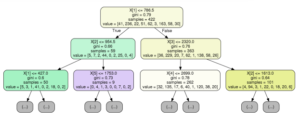
Bachelor Thesis at the University of Cologne – “Using Machine Learning to Derive Soil Information from Soil Reflectance Composites (SCMaP)”