End of Term Assignments
Spatial Data Infrastructure – Dashboard using Flask & Plotly Dash
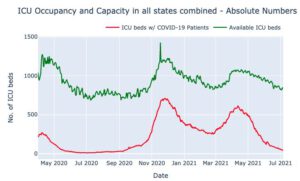
Creating a Dashboard, visualizing ICU occupancy rates in the Austrian federal states. A ubuntu 18.04 server hosts an Apache & WSGI installation, which runs a Plotly Dash via Flask. The data is automatically scraped and served via a GeoServer.