Regression – Gradient Descent Algorithm
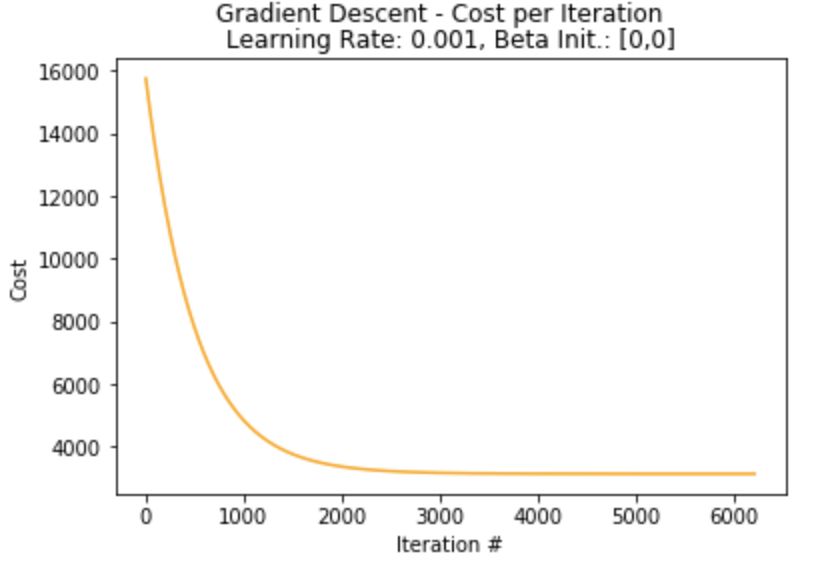
The following notebook performs simple and multivariate linear regression for an air pollution dataset, comparing the results of a maximum-likelihood regression with a manual gradient descent implementation.
Assessing Ship Sizes using SAR – Practical Application of Mathematic Morphology
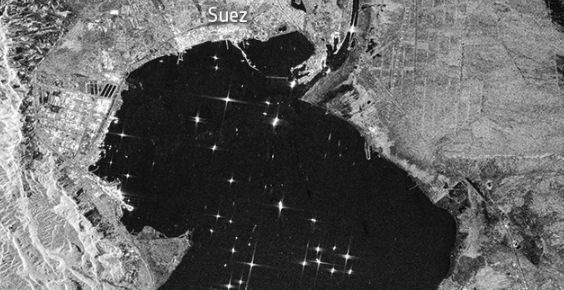
Based on the paper by M. Stasolla and H. Greidanus from 2016, a workflow is followed to estimate ship sizes based on Sentinel-1 imagery. Most importantly, a fundamental element in their workflow is the usage of mathematical morphology to “clean” the SAR image in order to estimate the real-world boundaries of ships
Crop Detection – Zindi ML Challenge
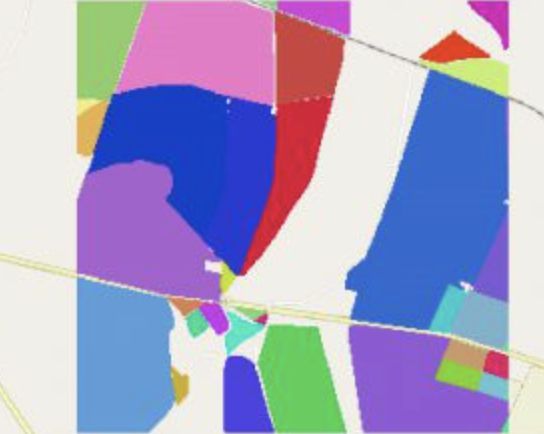
Hosted on the Zindi Data Science and Machine Learning platform, the “Radiant Earth Spot the Crop Challenge” challenges participants to correctly predict the type of crop grown on fields in South Africa, based on Sentinel 2 imagery.
Binary Mathematical Morphology
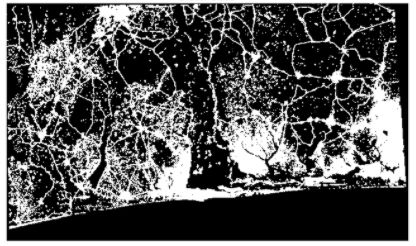
In this image processing class, some exercises were completed in (Binary) Mathematical Morphology. The used methods are erosion, dilation, opening, closing as well as skeletonize and convex hull. The binary image in this case is a geotiff representing sealed surfaces (1) or unsealed surfaces (0) in the Golf of Benin, spanning Togo, Benin and Nigeria
Flooding Event at ‘Inden’ Open Pit Mine – 3D Analysis
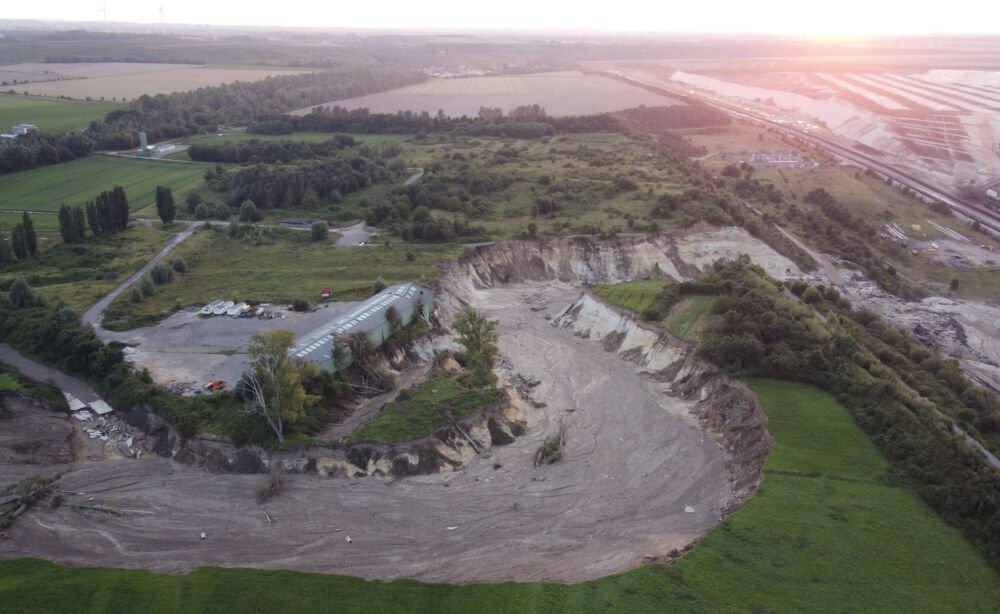
Using Photogrammetry, a newly formed erosion channel of the ‘Inde’ river is mapped. After the heavy rains in Germany in July 2021, the river reclaimed its former riverbed and floods the open pit mine.
ESRI IP Student of the Year Award!

Big thanks to Professors Josef Strobl, Stefan Lang, Dirk Tiede, Barbara Hofer and the whole Board of Professors at ZGIS for granting me the “Outstanding Student of the Year” Award by ESRIs Innovation Program.
PAISS Artificial Intelligence Summer School 2021

Summary of PAISS Artificial Intelligence Summer School, organized by INRIA and the institutes PRAIRIE and MIAI in July 2019.
Crop Yield Prediction – AGIT2021 Presentation
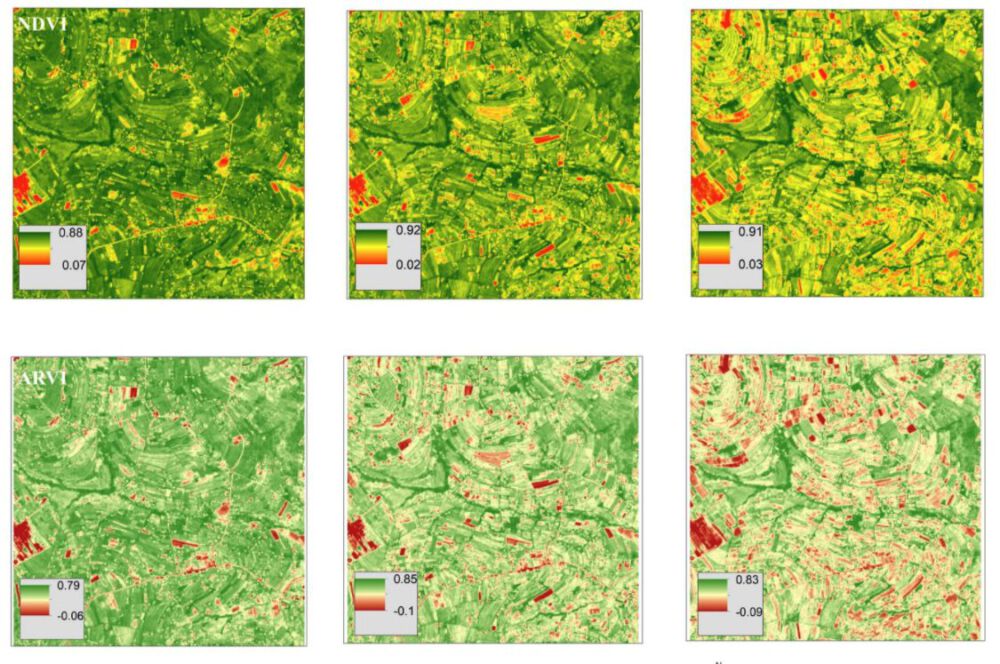
For the EO4GEO Summer School, a project on predicting maize crop yield in Kenya using time series data and a random forest was completed. Our work was presented at the AGIT2021 conference.
Spatial Data Infrastructure – Dashboard using Flask & Plotly Dash
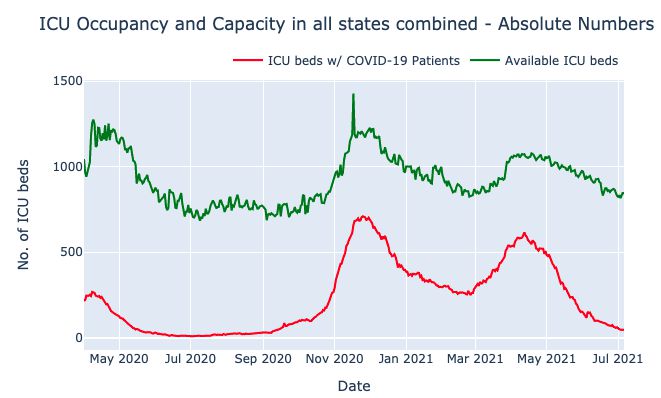
Creating a Dashboard, visualizing ICU occupancy rates in the Austrian federal states. A ubuntu 18.04 server hosts an Apache & WSGI installation, which runs a Plotly Dash via Flask. The data is automatically scraped and served via a GeoServer.
Velodrome Düren – UAS Surveying and Track Info Extraction
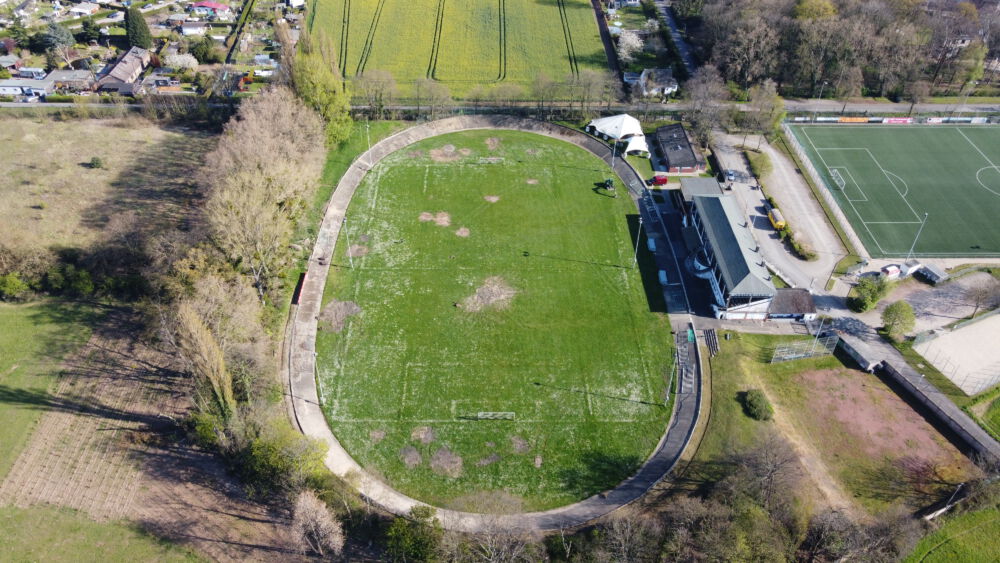
Aerial surveying of a 1920s era velodrome. Creation of DSM and Orthophoto in order to calculate track characteristics such as bank angle, track lenght and width as well as the turn radius.
