PostgreSQL & PostGIS – First Steps

SQL for spatial queries (1)

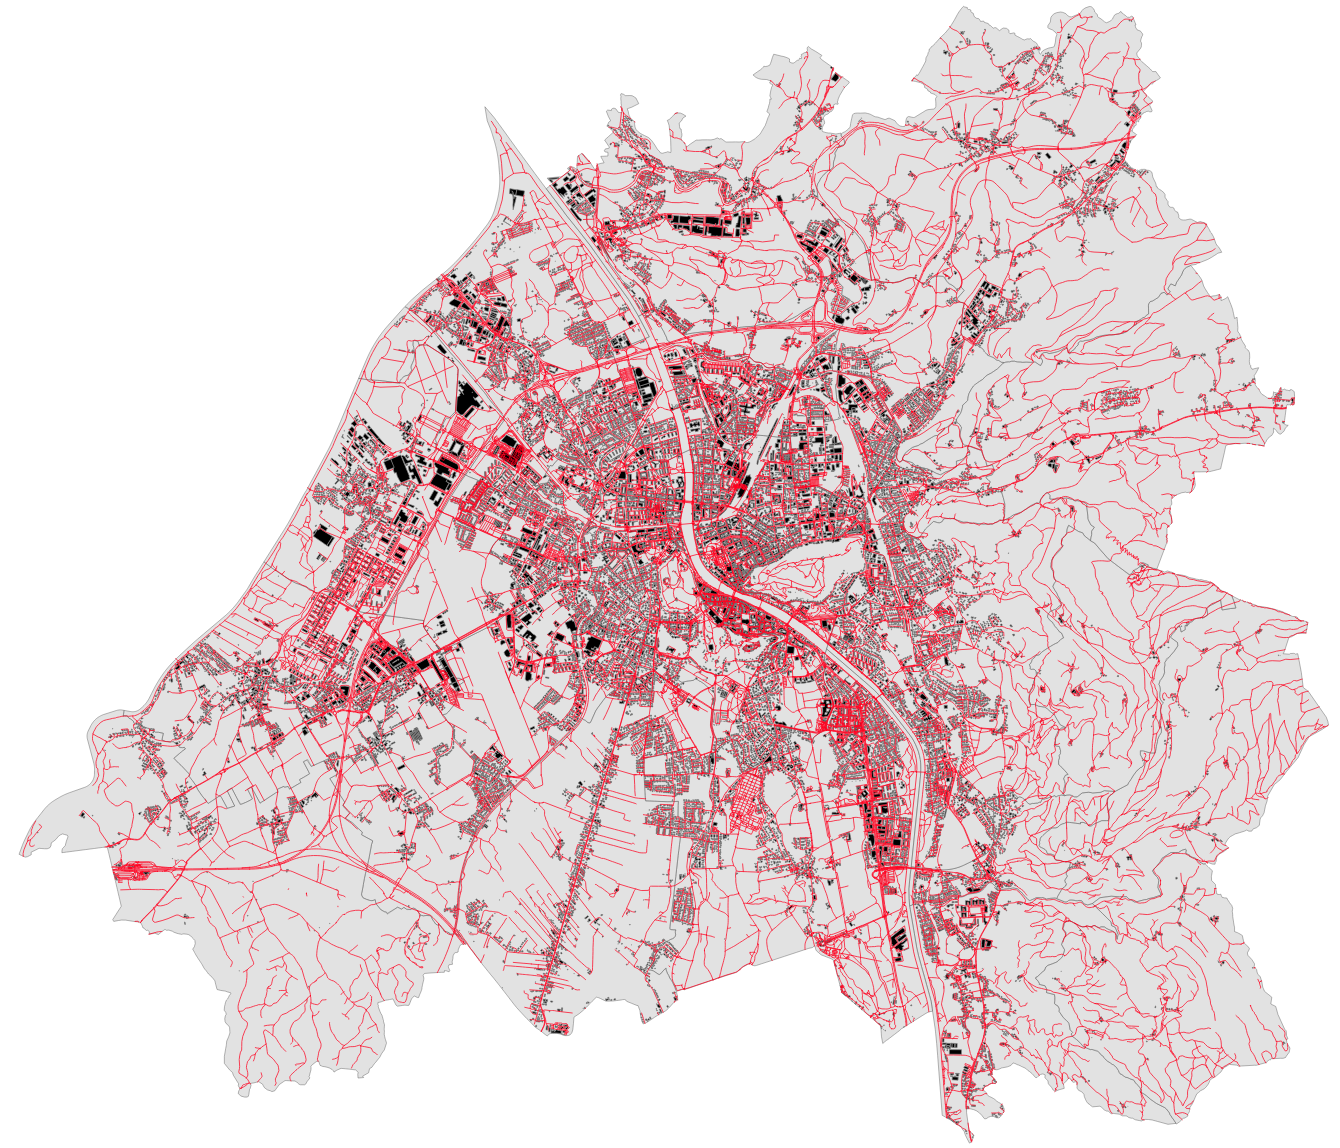
In this exercise, a connection between QGIS and the PostgreSQL/PostGIS Server is made, which is followed by loading vector shapefiles of Salzburgs district boundary, its roads and building footprints into the database. 
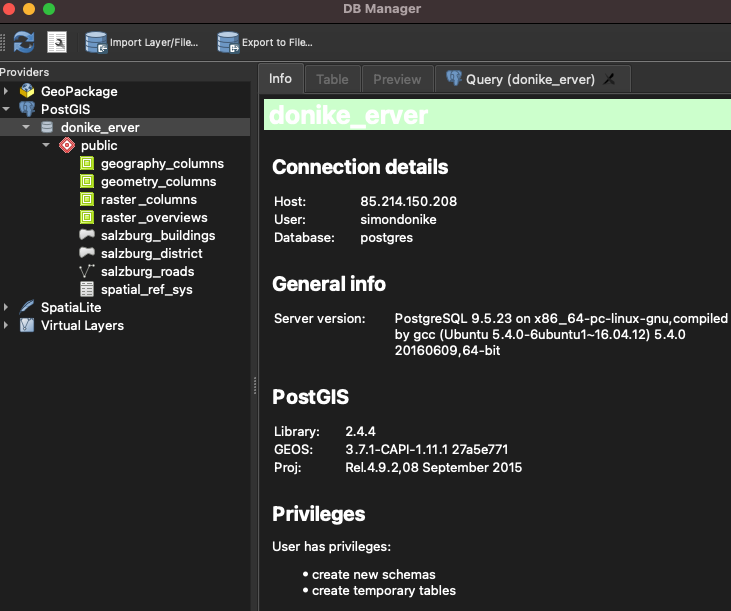
Image 1: Successful connection to the PostgreSQL server.
Image 2: PostgreSQL/PostGIS tables loaded into QGIS as Layers. The three layers are polyline features for the roads and polygons for the buildings and the districts of Salzburg.

Then, via SQL queries in the DB Manager within QGIS, several queries are executed. Three layers were extracted via these Queries:

  • Layer containing school buildings in Salzburg:
    • type= ‘school’
  •  Layer containing church buildings in Salzburg:
    • type= ‘church’
  •  Layer containing both church and school buildings in Salzburg:
    • type= ‘church’ OR type= ‘school’
SELECT
    *
FROM
    salzburg_buildings
WHERE
    type = 'church' or type = 'school'; 
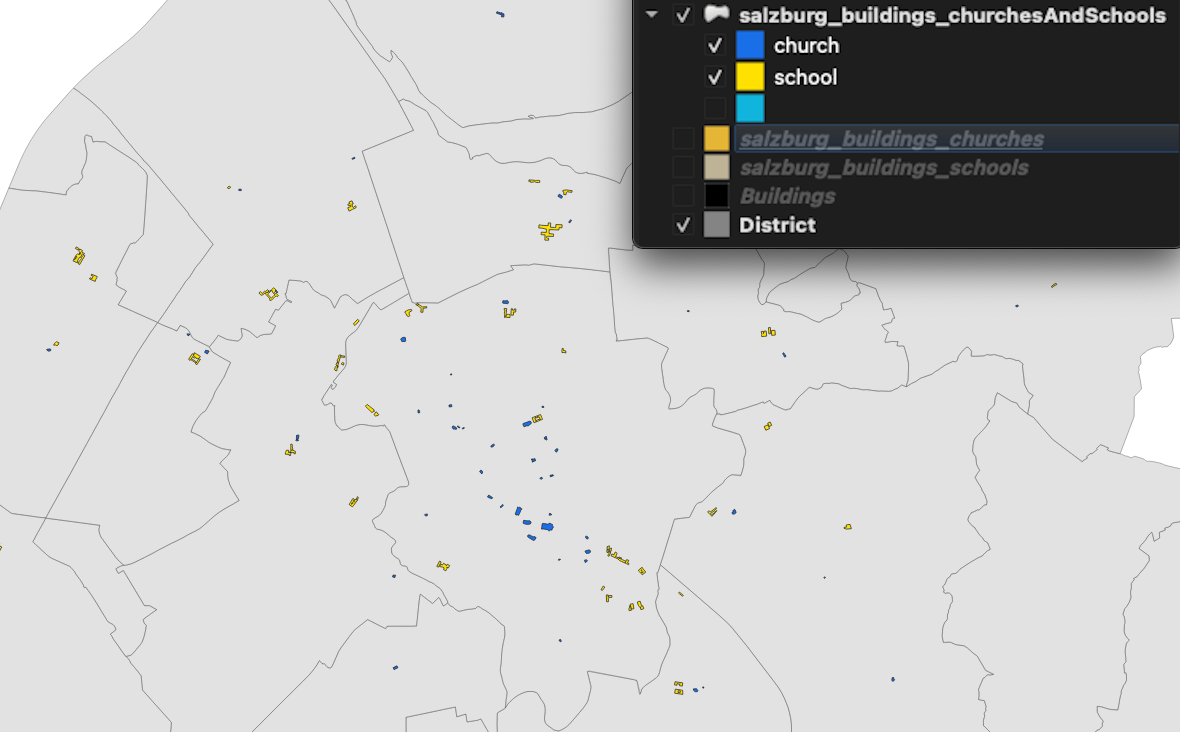
 Image 3: Layer resulting from SQL Query in QGIS. Visualized is the combined churches and schools layer, symbolized after their respective classifications of the “type” attribute.

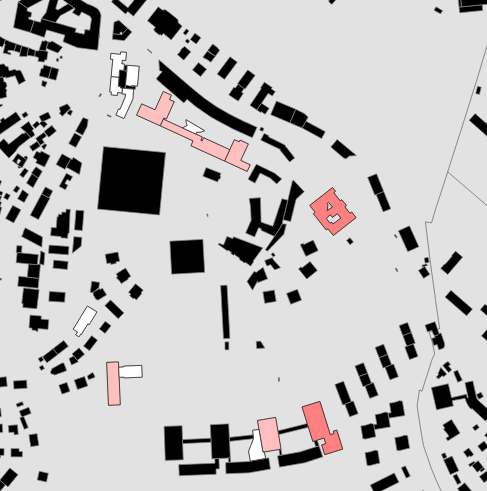
In the next step, we calculate the footprints of the school buildings as well. Following this, we load the resulting layer into QGIS and visualize the schools depending on their footprint. 

SELECT
    b.*,
    st_area(b.geom) as area
FROM
    salzburg_buildings AS b
WHERE
    type = 'school'; 
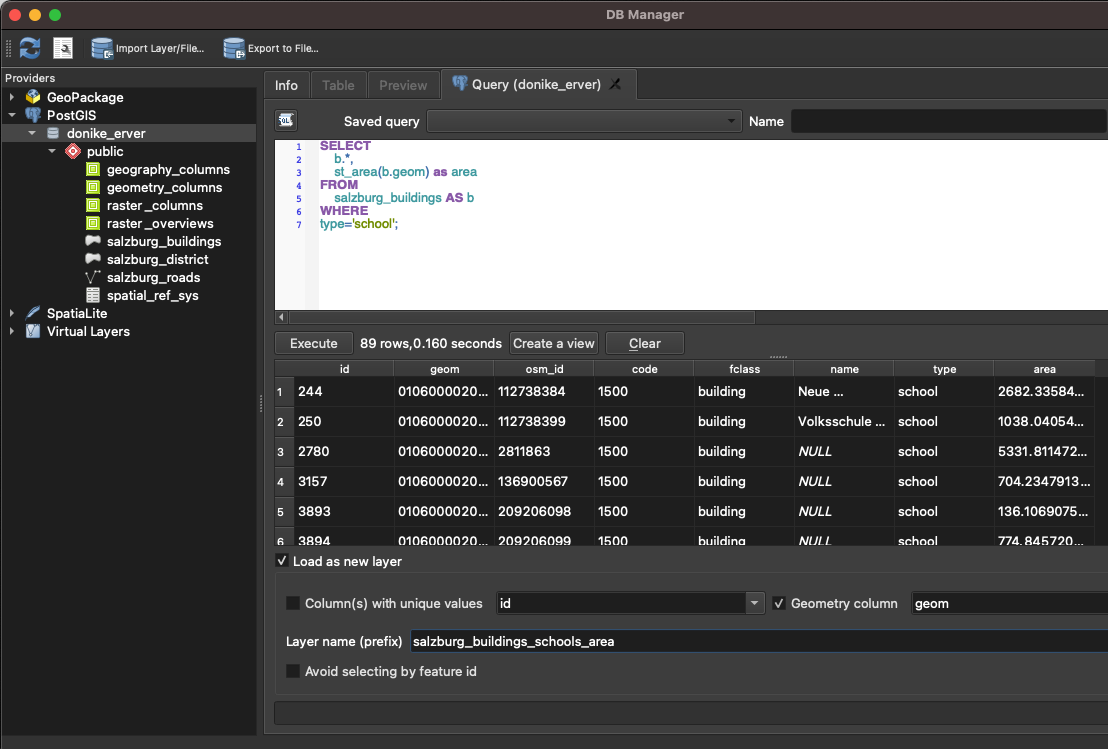
Image 3: Query and result for the area of school buildings
Image 5: School buildings are visualized depending on their footprint with red meaning bigger.

Next up is a selection by location, more specifically by the distance from the bell tower of the Salzburg fortress. Additionally, the result of the query is exported as a layer to QGIS.

SELECT
    b.*,
    st_distance(
        b.geom,
        g.geom) AS distance
FROM
    salzburg_buildings AS b,
    (SELECT geom FROM salzburg_buildings WHERE name = 'Glockenturm' AS g; 
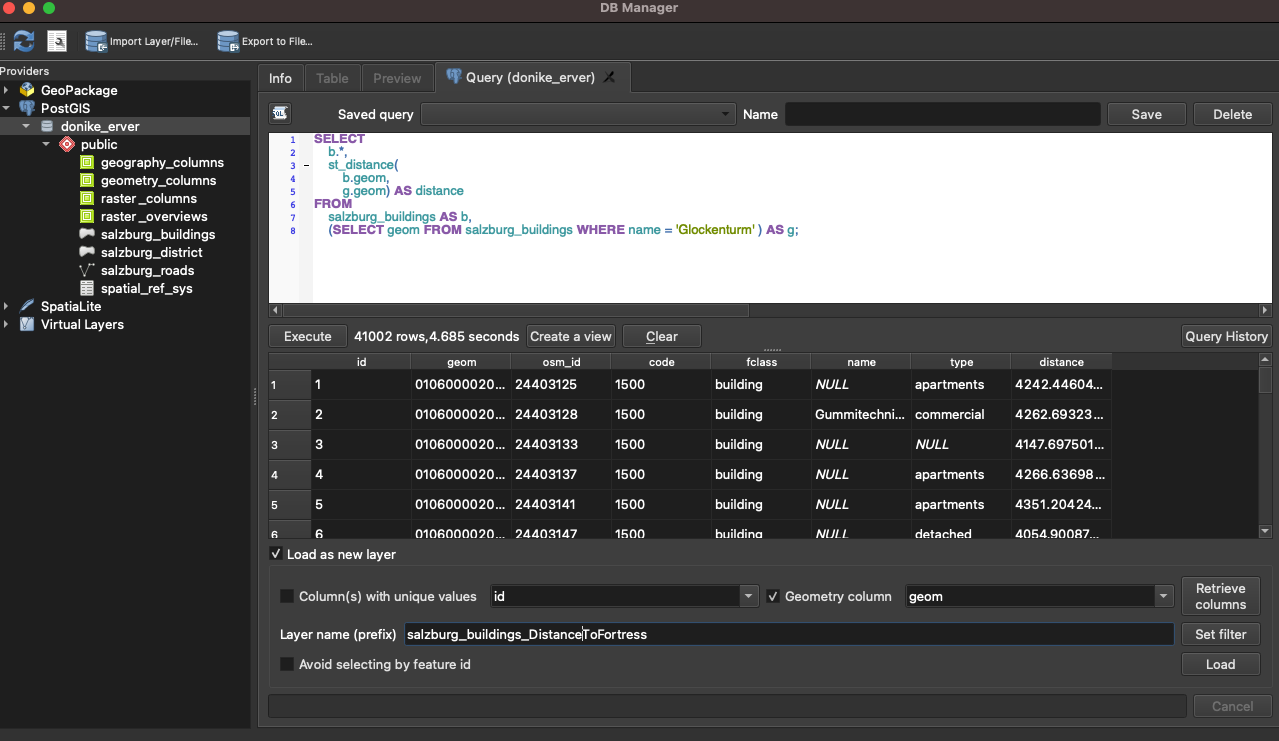
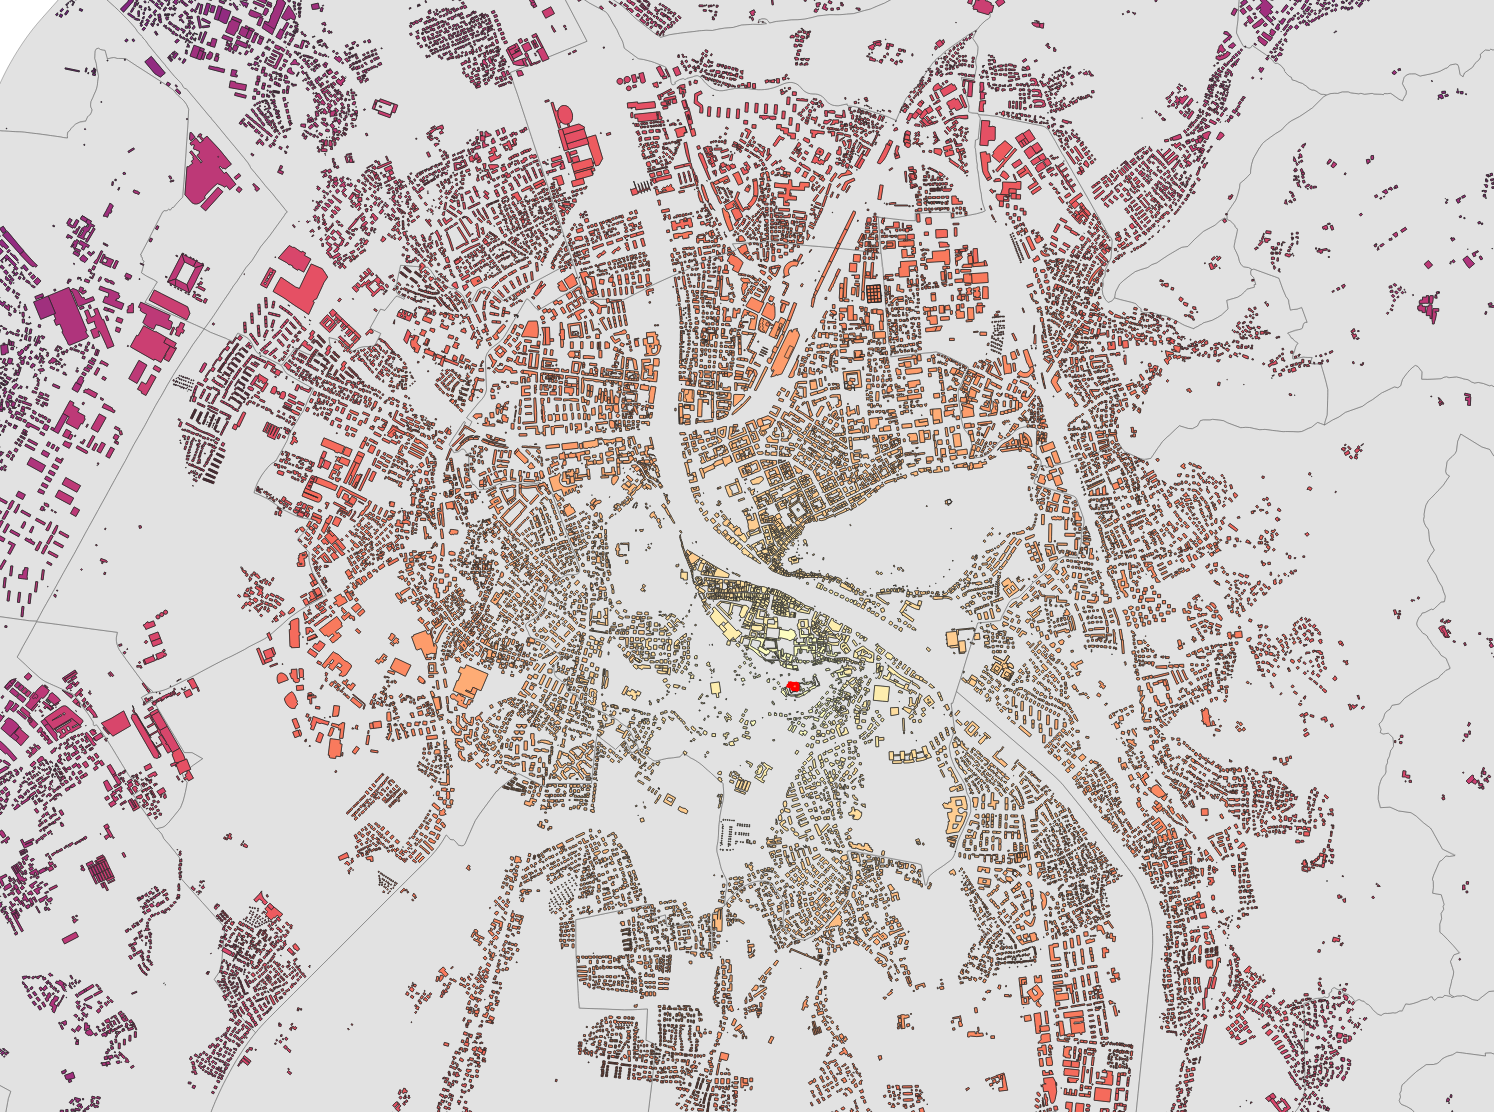
Image 6: Result of SQL Distance from Glockenturm query
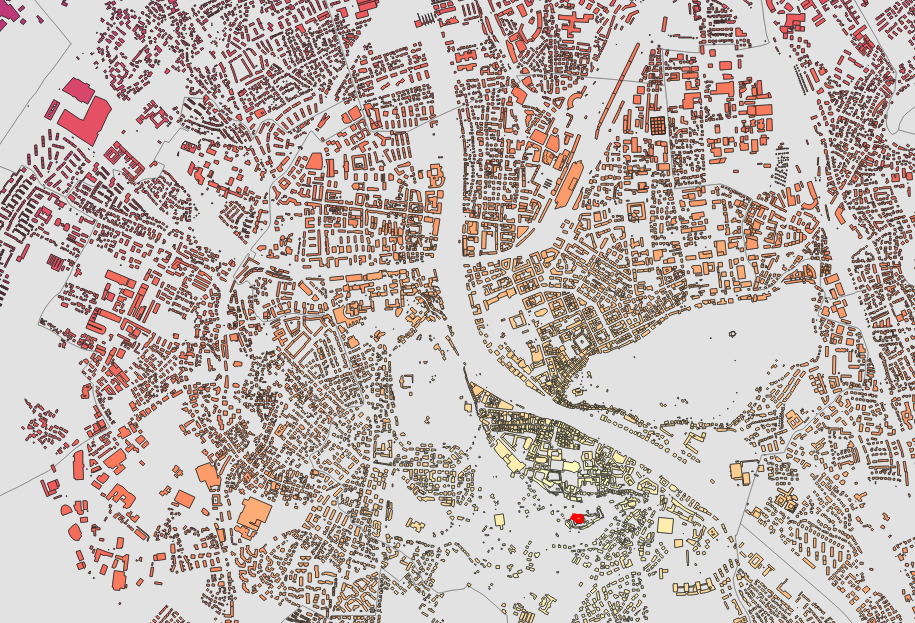
  The Layer symbology is then chosen to modify the color of each building depending not the distance from the Fortress bell tower. The „gradual“ symbology option is selected, a color ramp chosen and the breaks set to quantiles. 
Image 7: Visualization of buildings dependant on their distance from the belltower
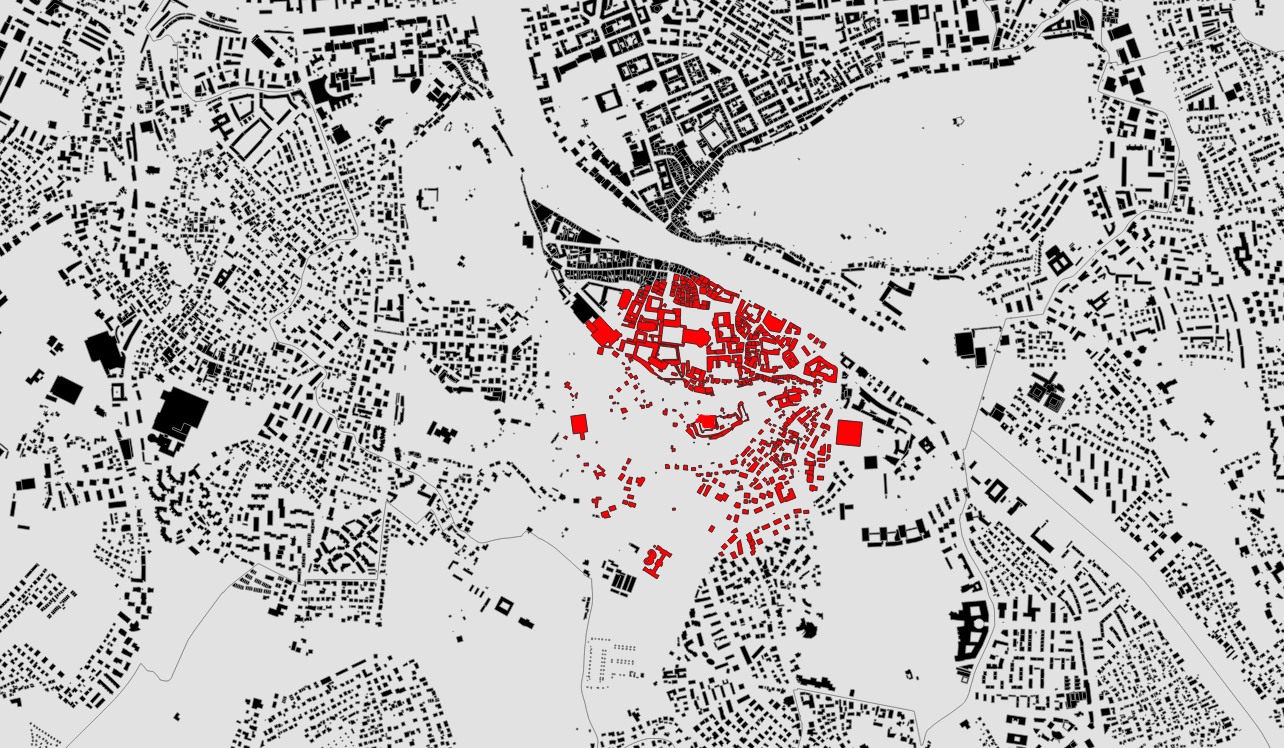
Following that, we use a SQL query again to extract those buildings, that are not farther than 500m from the Fortress bell tower.
SELECT
    b.*
FROM
    salzburg_buildings AS b,
    (SELECT geom FROM salzburg_buildings WHERE name = 'Glockenturm') AS g
WHERE
    st_distance(b.geom, g.geom) < 500; 
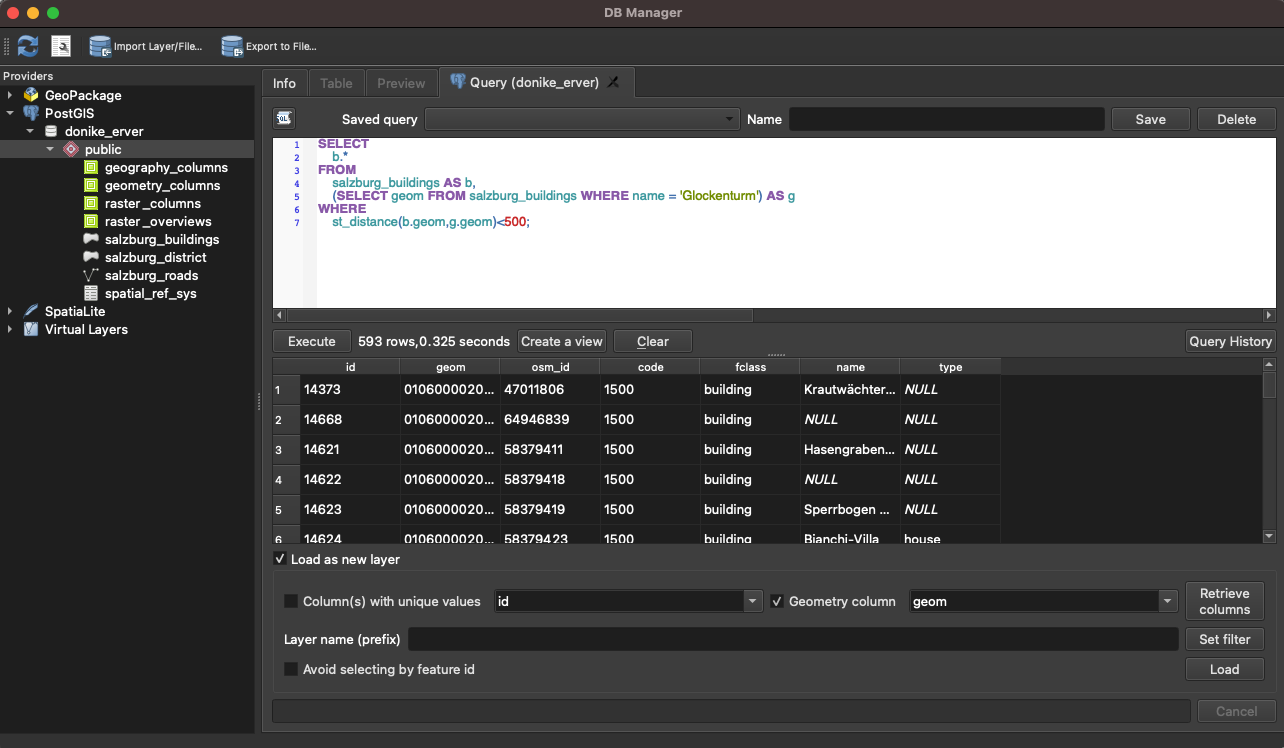
Image 8: Selecting buildings not further than 500m from the bell tower.
Image 9: Visualizing said buildings
593 buildings are within a radius of 500m from the Fortress bell tower The final task demands to find out the average footprints of buildings that are not farther than 1000m from the fortress bell tower. Firstly, a new column was permanently added to the table in order to hold the footprint area as a float data type. The st-area method applied for each building and saved to the area column. This method was chosen because I preferred to have the area column calculated and saved, but it is also possible to not save the area of each building and therefore do the calculation on-the-fly Then, the average was calculated for the area column for those buildings that are closer than 1000m to the bell tower. 
ALTER TABLE salzburg_buildings
ADD COLUMN area float;

UPDATE salzburg_buildings
SET area = ST_AREA(geom);

SELECT
    AVG(area)
FROM
    salzburg_buildings AS b,
    (SELECT geom FROM salzburg_buildings WHERE name = 'Glockenturm' AS g
WHERE
    st_distance(b.geom,g.geom) <1000; 
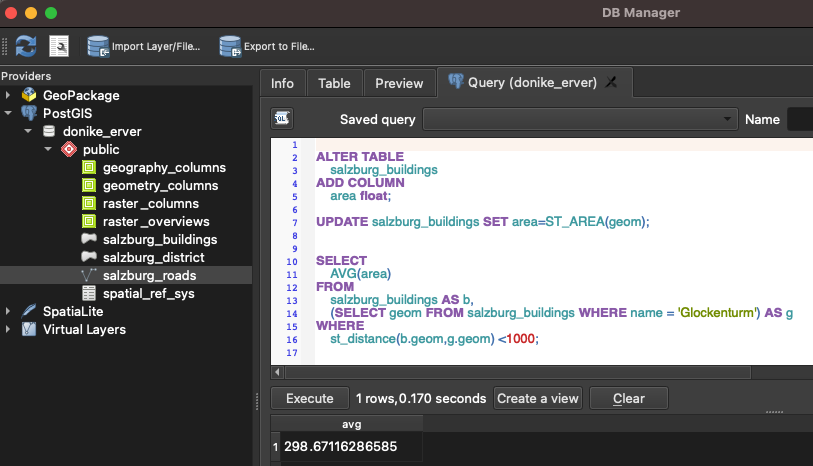
Image 10: SQL Query corresponding to the task. Result is visible at the bottom: 298.67

The 1905 buildings within 1.000m have an average footprint of 298.67. Because the WGS84 system is used, the result is in square meters.

Further Reading
Recent Updates